A practical example
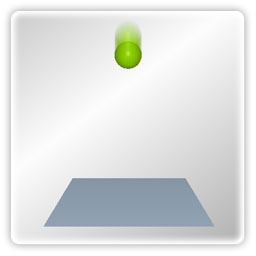
This example considers the impact of a solid sphere failing under gravity, into a rigid plane surface using the theory behinds Newton's second law of motion. The sphere has the same material properties as the rigid surface. The following is what we know about the experiment's values: [20]
- Incoming velocity
- V1 = 0.2 m/s
- Young's modulus
- E = 7×10¹⁰ N/m2
- Poisson's ratio
- ν = 0.3
- Material density
- ρ = 2699 Kg/m3
- Radius of sphere
- r = 0.1 m
- Shear modulus
- τ = 2×10¹⁰ N/m2
- Friction coefficient
- k = 0.35
EDEM Simulation
The above values were used as the main inputs in the simulation process. The short video shows an EDEM software simulation of the impact of a solid sphere falling under gravity, and bouncing on a rigid plane surface.
The Analytical solution
Also, the same values of the above example were use in the analytical solution; this gives the opportunity to compare both results as you can see in Table 1, at the bottom of this page.
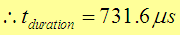
The contact duration time (tduration) for this example is:
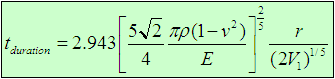
Thus:
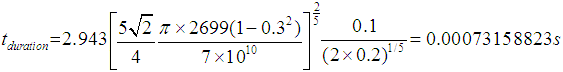
Thus:

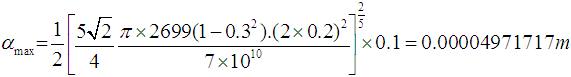
The maximum contact displacement αMax for the sphere impacting on the rigid plane with incoming velocity V1 = 0.2m/s can be determined from the following equation:
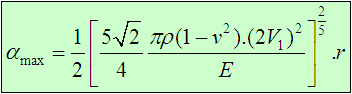
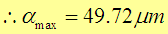
Thus:

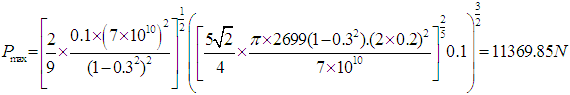
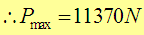
The maximum contact force PMax for the sphere impacting on the plane with incoming velocity V1 = 0.2m/s can be determined from the following equation:
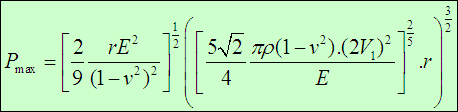
Thus:
Elastic normal contact of a sphere with a rigid surface-DEM code benchmark test
This test was firstly done by Timoshenko and Goodier, 1970, to check elastic normal contact between a sphere and a surface.
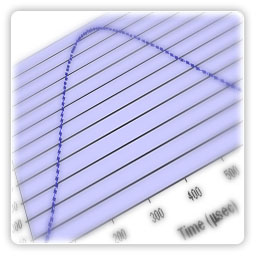
EDEM code was subjected to this benchmark test and results are presented in form of graphs below. Figure 5 presents the normal contact force against the normal contact displacement, whereas Figure 6 shows the evolution of the normal contact force against the time. [20]
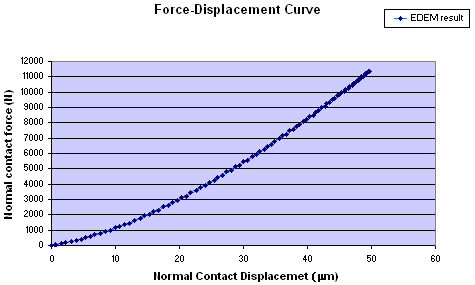
Figure 5. Force versus displacement curve
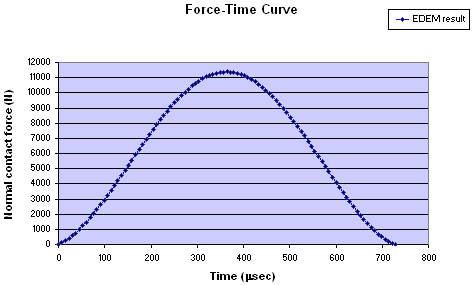
Figure 6. Force verses time curve
Table 1 presents the comparison of the contact duration, maximum normal contact displacement and contact force between the DEM results and analytical solutions obtained from equations above.
| Physical quantities | EDEM results | Analytical solution | Difference (%) |
| Contact duration (μs) | 731.450 | 731.59 | 0.019 |
| Maximum displacement (μm) | 50.000 | 49.717 | 0.567 |
| Maximum force (N) | 11377 | 11370 | 0.062 |
Table 1. comparison between DEM results and analytical solutions for the elastic normal impact of a sphere with a rigid plane. [20]
» Next: References